GIS Projects
These projects were executed with the utilization of a variety of programs, including: RStudio, ArcGIS, QGIS, Inkscape, GIMP, MATLAB, and GeoDa.
The links below can be used to view the code and process used to create the outputs.
The Impact of COVID-19 in Wildfire Impacted Areas
Distribution of the Land Cover Change in Delhi, India
My role in this group project was conducting the raster analysis on the area of interest and creating the graphs.
Raster Analysis: Land Use in California
- Utilized raster data and satellite imagery to differentiate between various forms of land use in QGIS.
Distribution of COVID-19 cases in CA
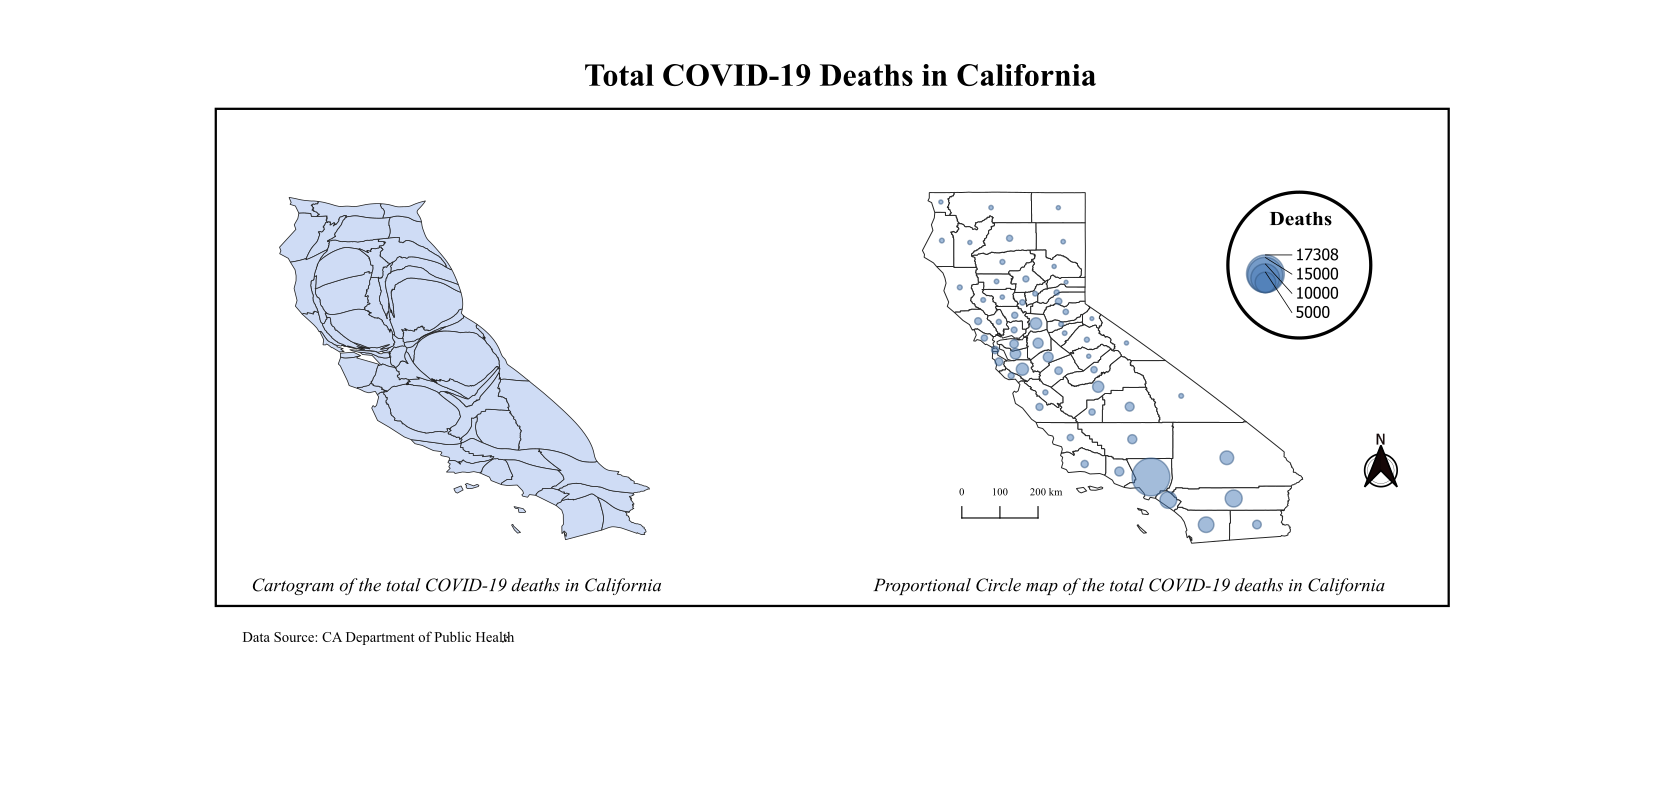
Distribution of COVID-19 Deaths in CA
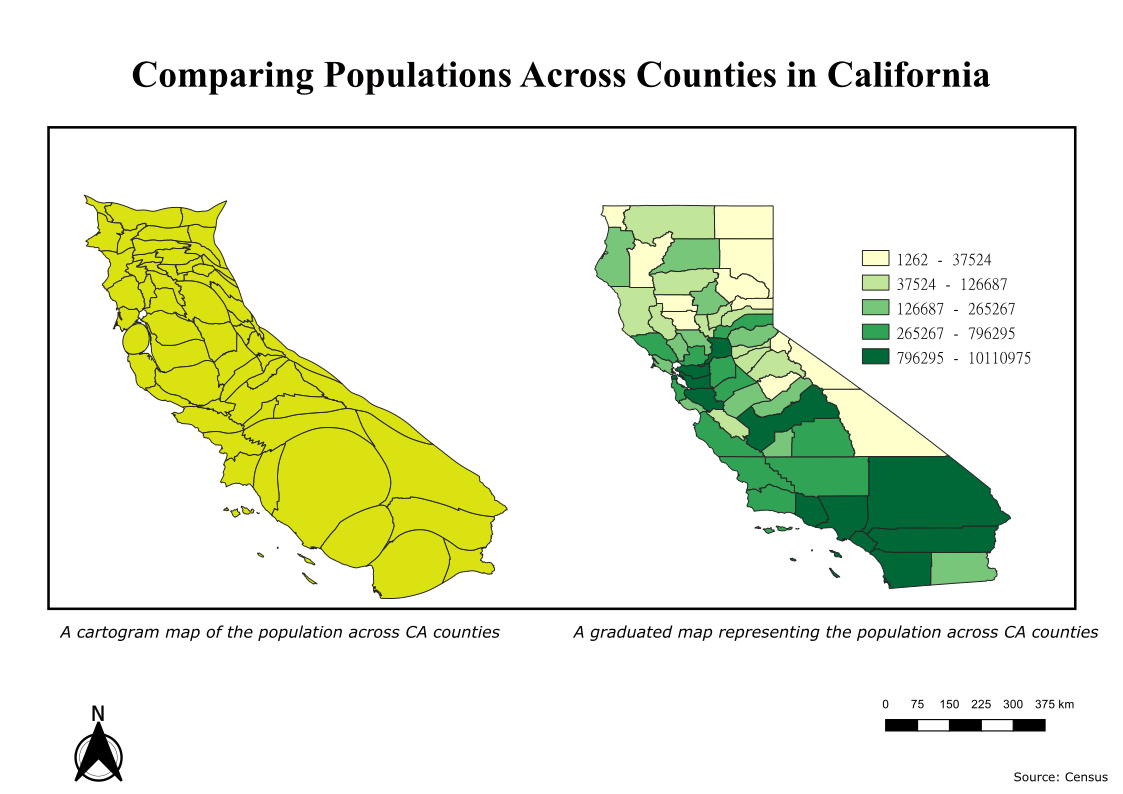
Distribution of populations in California counties
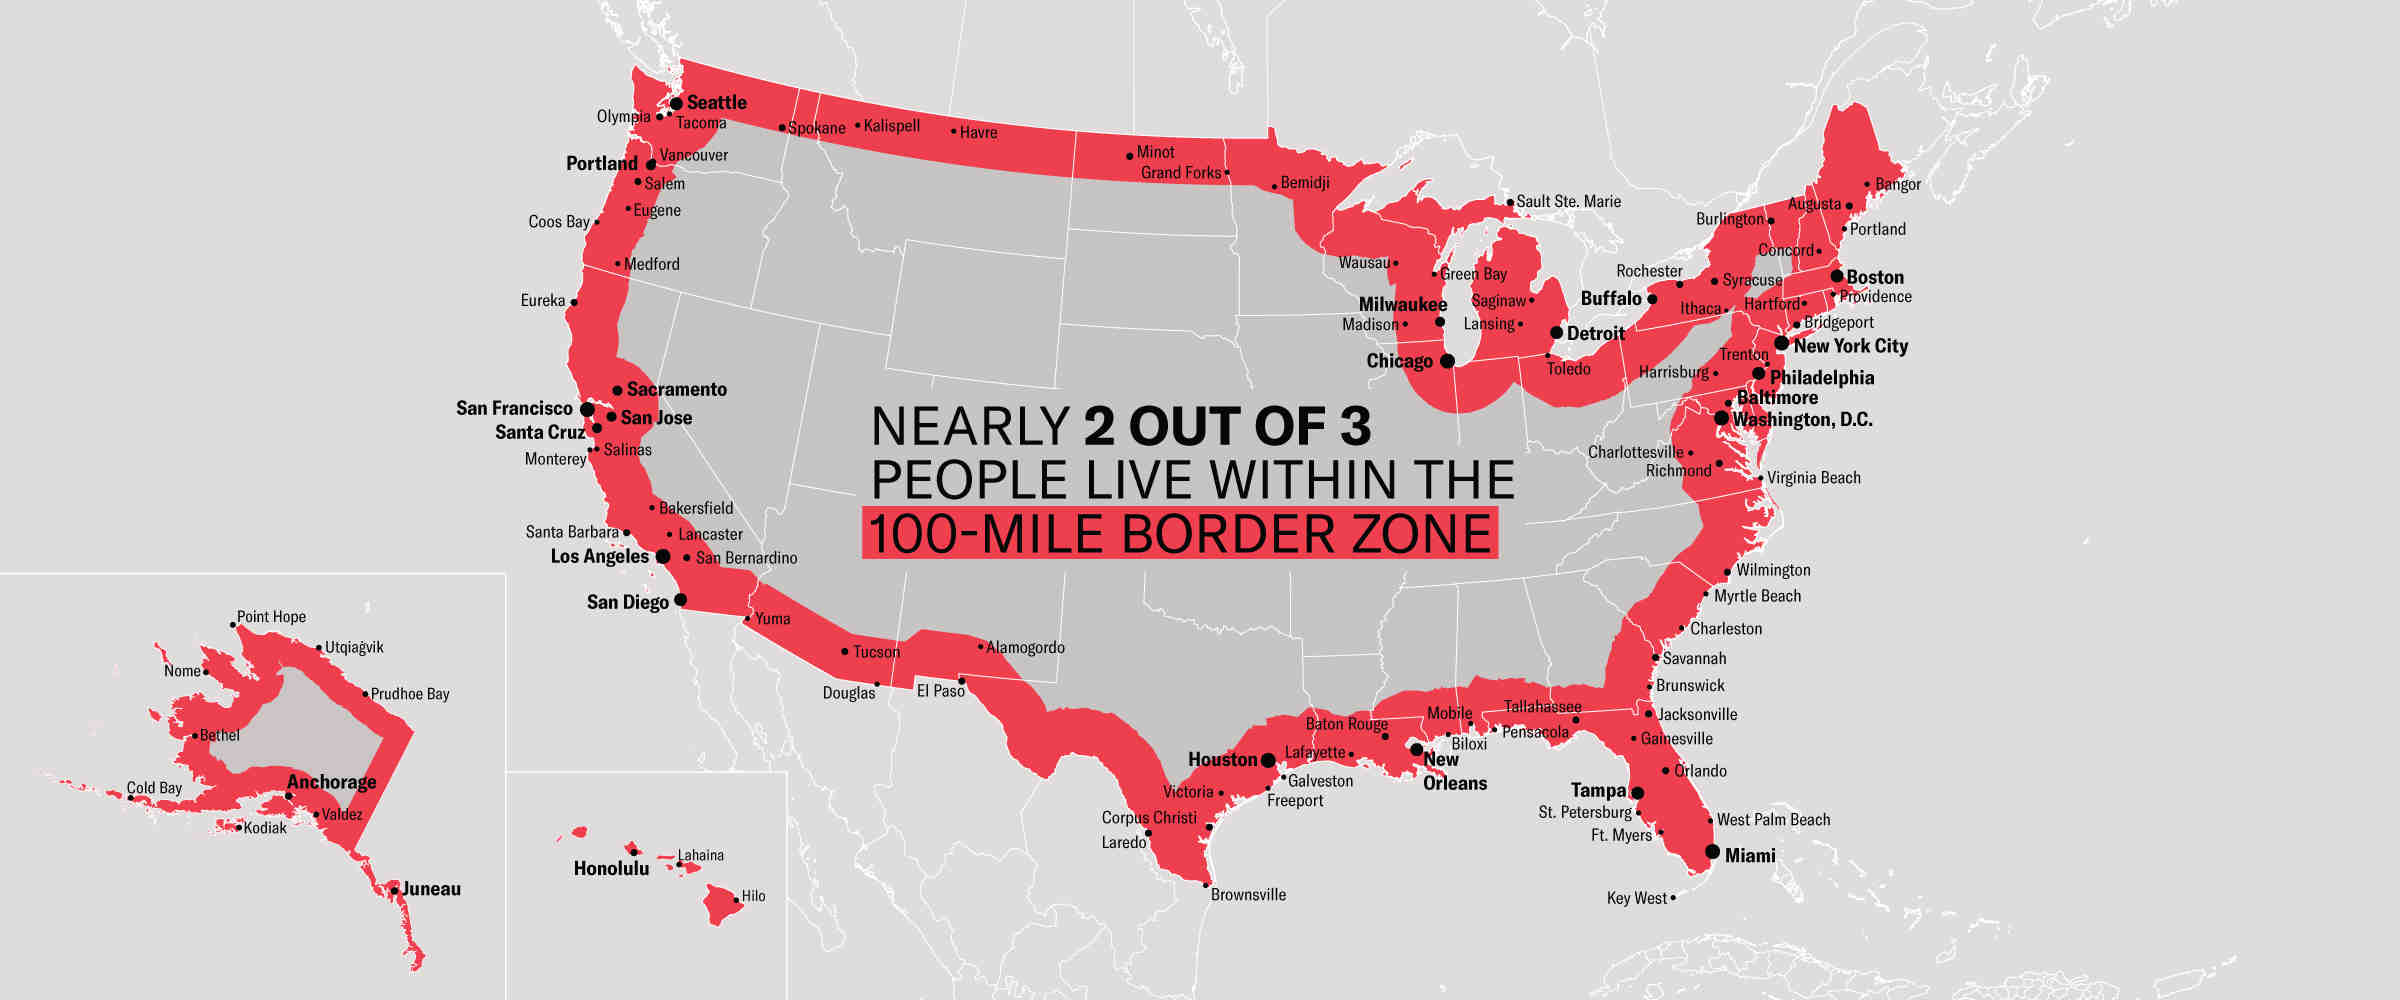
Representing U.S. Cities and Distance
- Visually representing U.S. cities based on population and distance to different borders.
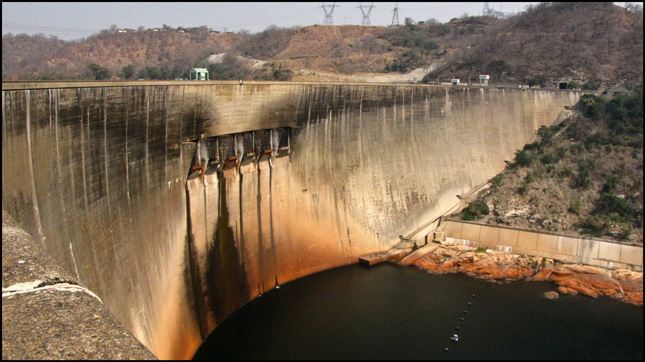
Distribution of Dams in U.S.
- Using different tessellations in order to highlight specific uses of Dams in the U.S. and differentiate between them in a map.
Historical Distribution of Tsunamis Caused by Earthquakes